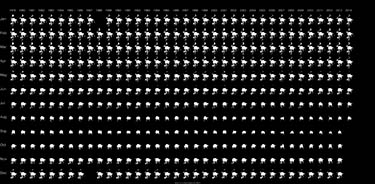
Mini Multiples Display Decades Of Sea Ice In A Trice

NASA’s Scientific Visualization Studio shrank the images to make a graphic that illustrates not only when Arctic sea ice extent is at its annual minimum and maximum, but also how sea ice has changed over the last three decades.
Data collected by satellite between 1981 and 2001 show that some Arctic regions are warming as quickly as 2.5 degrees Celsius per decade. September 2012 reached a low of 3.6 million square kilometers, almost half as much as the 1979 to 2000 mean of 7 million square kilometers.
There are two months' worth of data missing from the chart, besides the data yet to be collected for the remainder of 2014. According to the NSIDC, no images were taken between Thursday, December 3, 1987 and Tuesday, January 13, 1988. This was due to problems with the satellite the Defense Meteorological Satellite Program used at the time to capture the images.
This article was originally posted to NASA's Global Climate Change website.
Reach contributor Jeanette Kazmierczak here.


