Age And Travel Historically Non-Factors In USC Football
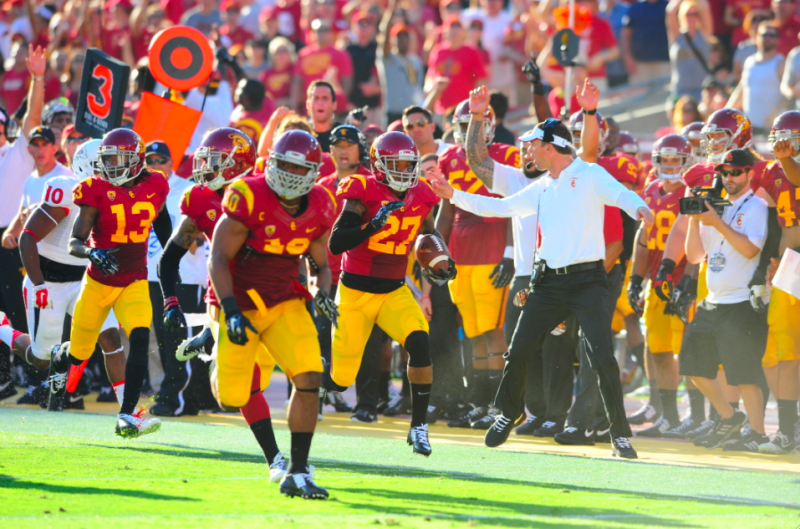
The celebration did not last long.
The Trojans faced a reality check this past weekend as Boston College pulled off a surprising upset behind a spectacular performance from quarterback Tyler Murphy. USC dropped 8 spots in the AP poll and is currently ranked No. 17 in the nation.
After the loss, the Trojans faced strong criticism concerning several aspects of their game.
The strenuous journey to Boston College was blamed as an initial factor. With a three-hour time difference, 3,000 mile distance and multiple hours spent sitting on planes and buses, it is easy to assume that travel is a culprit for the team’s uncharacteristic loss.
Additionally, the Trojans' young and immature offensive line served as a scapegoat. The game against Boston College exposed significant weaknesses in the unit. Quarterback Cody Kessler was sacked five times.
However, looking at statistics from the past five seasons (2009-2013), patterns show that neither travel nor age affect the Trojans' wins and losses as much as people would like to think it does. In three categories, average yards gained per play, third down conversion and red zone conversion, there is no major discernable difference or pattern within the three categories in wins and losses at home or away to prove that such factors like age or travel are to blame.
Average Yards Gained Per Play (Charts A & B)
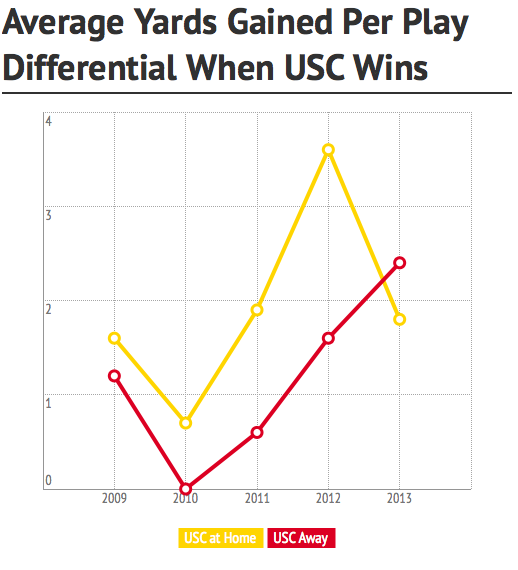
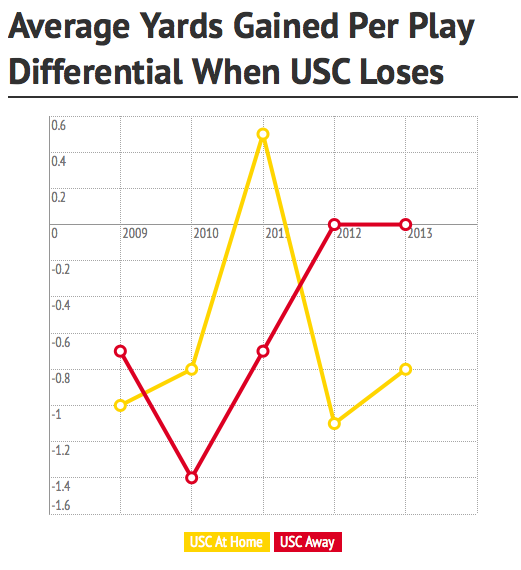
A high number in this category is crucial if the Trojans hope to advance the ball and score. In the loss against Boston College, the Trojans averaged a gain of 4.8 yards per play in comparison to the Eagles’ 7.4 yards. Over the course of the whole game, this was the ultimate difference maker. However, over the past five years there was no major difference in this cartegory in home versus away games, as many would like to believe. Chart A looks at the differential in average yards gained when USC wins at home versus wins away. Though USC at home averages more yards per play, it is not that much of a difference. Chart B looks at the same differential when USC loses. The results are sporadic. No conclusion can be made that USC performs better at home versus away games when it comes to average yards gained per play.
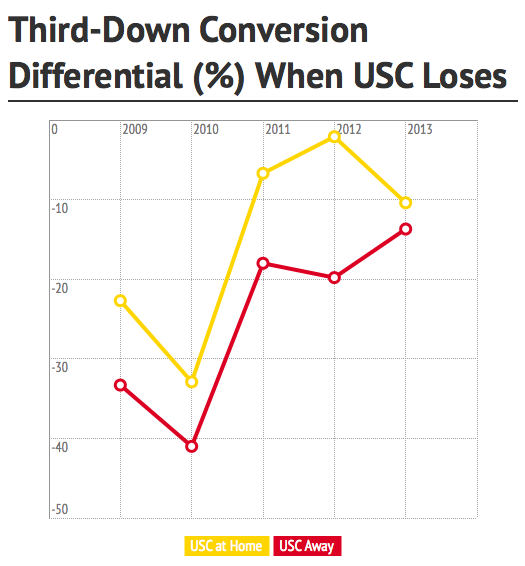
Third Down-Conversion (Charts C & D)
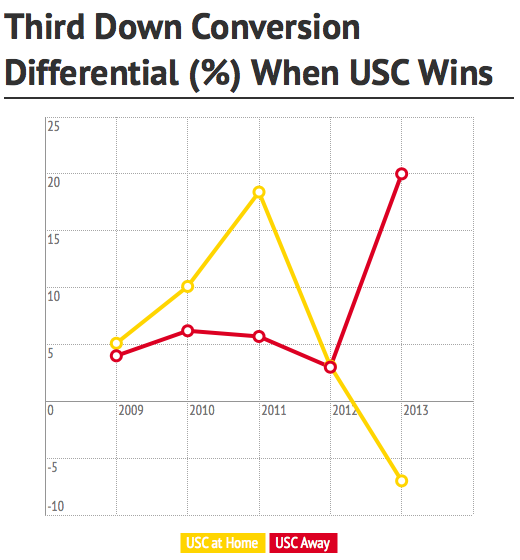
One of the most telling statistics of an offense's proficiency is its ability to convert on third-down. Against the Eagles, the Trojans fared better than their opponent, but it still does not excuse the fact that they converted on a mere 31-percent of third downs (5 of 16). Looking at the Trojans' third-down conversion over the past five seasons, their conversion percentage differential is higher at home versus away games, but the two are not alarmingly far apart. Both home and away, USC’s third-down conversion differential dips low into the negative percentages.
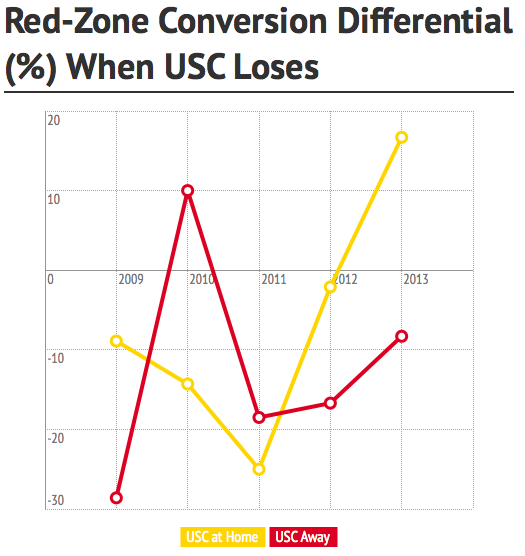
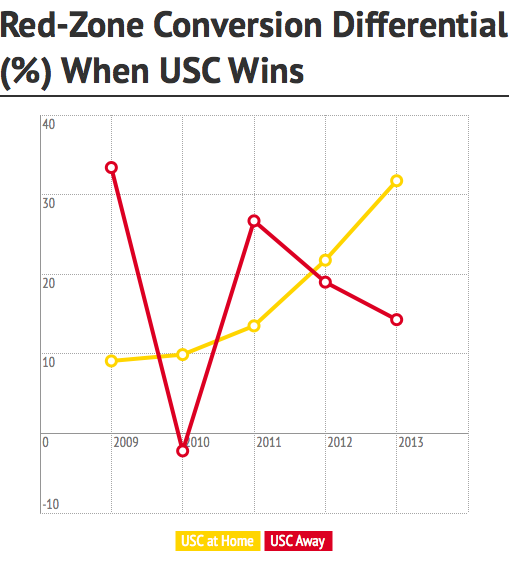
Red-Zone Conversion (Charts E & F)
The Trojans' have to capitalize when they are in the red-zone to take advantage of all their opportunities. Against the Eagles, the Trojans were a perfect 3-3 in red-zone conversions. Though the Eagles only converted in the red-zone 80-percent of the time, they had a higher total of conversions than the Trojans. It is expected that the Trojans would fare better at home with a higher red-zone completion differential. However, looking at the statistics, there is no consistent pattern over the course of the past five seasons to prove that USC’s completion differential in the red-zone is significantly better at home than away. USC’s performance in the red-zone has been historically sporadic over that time, with no relationship to geographic location.
Though this analysis only looks at three offensive statistics, they are fairly accurate predictors of how efficient the Trojan offense has been in the recent past. There is an overall pattern that the Trojans measure worse in these categories when they lose, whether or not they are at home and with no reagrd to the experience of their offensive line. Though in some categories the differentials in home wins versus away wins is higher, this does not prove to be a mathematically significant difference. At the same time, there is no consistent pattern when it comes to differentials in away losses and away wins. Neither location nor age can be blamed as a factor.
It may be too early in the season to conclude whether or not the Trojans' historically sporadic offensive efficiency will continue, but the new era of Steve Sarkisian provides a new chance to break tradition and establish a permanent change. With a bye week ahead, the Trojans have an extra week to establish some much needed consistency.
Reach Marah Alindogan via e-mail here.
Follow Marah Alindogan on Twitter.


